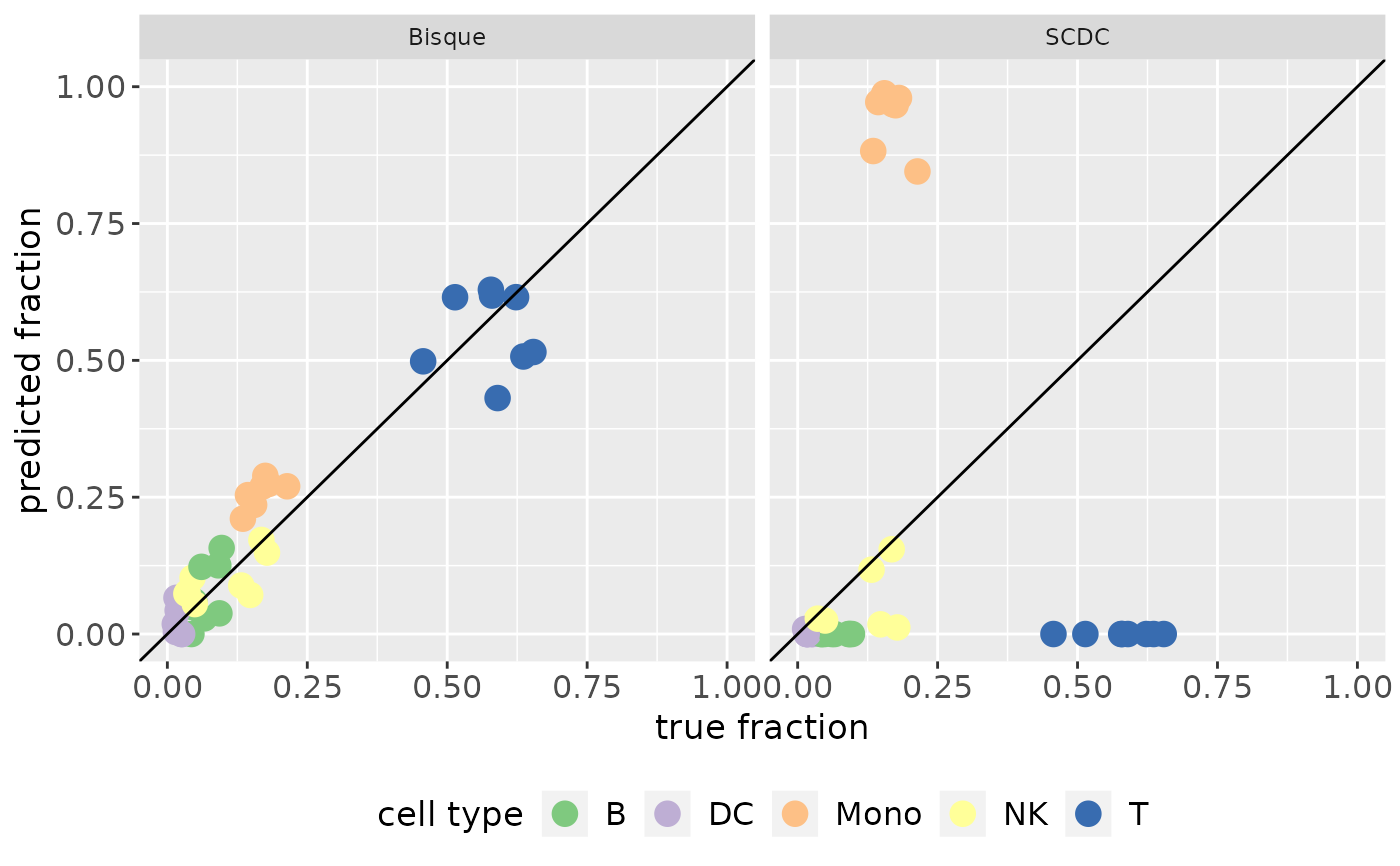
Make a Scatterplot for Benchmarking
make_benchmarking_scatterplot(result_list, ref_data, file_name = NULL)Arguments
Value
the ggplot object
Examples
data("single_cell_data_1")
data("cell_type_annotations_1")
data("batch_ids_1")
data("bulk")
data("RefData")

common_genes <- intersect(rownames(single_cell_data_1), rownames(bulk))[1:2000]

single_cell_data <- single_cell_data_1[common_genes, 1:500]
cell_type_annotations <- cell_type_annotations_1[1:500]
batch_ids <- batch_ids_1[1:500]
bulk <- bulk[common_genes, ]

RefData <- RefData[, order(colnames(RefData))]

res_bisque <- deconvolute(
  bulk, NULL, "bisque", single_cell_data,
  cell_type_annotations, batch_ids
)

res_scdc <- deconvolute(bulk, NULL, "scdc", batch_ids,
  single_cell_object = single_cell_data,
  cell_type_annotations = cell_type_annotations
)
#> You requested to run scdc which is currently not installed. Do you want to install the packages required for it: omnideconv/SCDC (Yes/no/cancel)
#> To install the dependencies for all methods at once, run devtools::install_github("omnideconv/omnideconv", dependencies = c("Imports", "Suggests"))
#> Using github PAT from envvar GITHUB_PAT. Use `gitcreds::gitcreds_set()` and unset GITHUB_PAT in .Renviron (or elsewhere) if you want to use the more secure git credential store instead.
#> Downloading GitHub repo omnideconv/SCDC@HEAD
#> xbioc      (NA -> 1354168bd...) [GitHub]
#> fastmatrix (NA -> 0.6-6       ) [CRAN]
#> pheatmap   (NA -> 1.0.13      ) [CRAN]
#> reshape    (NA -> 0.8.10      ) [CRAN]
#> nnls       (NA -> 1.6         ) [CRAN]
#> L1pack     (NA -> 0.62-4      ) [CRAN]
#> Downloading GitHub repo renozao/xbioc@HEAD
#> pkgmaker     (NA -> e9dbb8252...) [GitHub]
#> Biostrings   (NA -> 2.80.1      ) [CRAN]
#> DBI          (NA -> 1.3.0       ) [CRAN]
#> blob         (NA -> 1.3.0       ) [CRAN]
#> KEGGREST     (NA -> 1.52.2      ) [CRAN]
#> RSQLite      (NA -> 3.53.3      ) [CRAN]
#> checkmate    (NA -> 2.3.4       ) [CRAN]
#> BiocManager  (NA -> 1.30.27     ) [CRAN]
#> Annotatio... (NA -> 1.74.0      ) [CRAN]
#> Downloading GitHub repo renozao/pkgmaker@develop
#> registry (NA -> 0.5-1) [CRAN]
#> Installing 1 packages: registry
#> Installing package into ‘/home/runner/work/_temp/Library’
#> (as ‘lib’ is unspecified)
#> ── R CMD build ─────────────────────────────────────────────────────────────────
#> * checking for file ‘/tmp/RtmpaRZ4nB/remotes375fec21240/renozao-pkgmaker-e9dbb82/DESCRIPTION’ ... OK
#> * preparing ‘pkgmaker’:
#> * checking DESCRIPTION meta-information ... OK
#> * checking for LF line-endings in source and make files and shell scripts
#> * checking for empty or unneeded directories
#> Removed empty directory ‘pkgmaker/vignettes’
#> * building ‘pkgmaker_0.32.8.tar.gz’
#>
#> Installing package into ‘/home/runner/work/_temp/Library’
#> (as ‘lib’ is unspecified)
#> Installing 8 packages: Biostrings, DBI, blob, KEGGREST, RSQLite, checkmate, BiocManager, AnnotationDbi
#> Installing packages into ‘/home/runner/work/_temp/Library’
#> (as ‘lib’ is unspecified)
#> Skipping install of 'pkgmaker' from a github remote, the SHA1 (e9dbb825) has not changed since last install.
#>   Use `force = TRUE` to force installation
#> ── R CMD build ─────────────────────────────────────────────────────────────────
#> * checking for file ‘/tmp/RtmpaRZ4nB/remotes375f500418d4/renozao-xbioc-1354168/DESCRIPTION’ ... OK
#> * preparing ‘xbioc’:
#> * checking DESCRIPTION meta-information ... OK
#> * checking for LF line-endings in source and make files and shell scripts
#> * checking for empty or unneeded directories
#> * looking to see if a ‘data/datalist’ file should be added
#> * building ‘xbioc_0.1.19.tar.gz’
#>
#> Installing package into ‘/home/runner/work/_temp/Library’
#> (as ‘lib’ is unspecified)
#> Installing 5 packages: fastmatrix, pheatmap, reshape, nnls, L1pack
#> Installing packages into ‘/home/runner/work/_temp/Library’
#> (as ‘lib’ is unspecified)
#> Skipping install of 'xbioc' from a github remote, the SHA1 (1354168b) has not changed since last install.
#>   Use `force = TRUE` to force installation
#> ── R CMD build ─────────────────────────────────────────────────────────────────
#> * checking for file ‘/tmp/RtmpaRZ4nB/remotes375ff9999e6/omnideconv-SCDC-dc2b0ef/DESCRIPTION’ ... OK
#> * preparing ‘SCDC’:
#> * checking DESCRIPTION meta-information ... OK
#> * checking for LF line-endings in source and make files and shell scripts
#> * checking for empty or unneeded directories
#> Omitted ‘LazyData’ from DESCRIPTION
#> * building ‘SCDC_0.0.0.9000.tar.gz’
#>
#> Installing package into ‘/home/runner/work/_temp/Library’
#> (as ‘lib’ is unspecified)
#> Creating Basis Matrix adjusted for maximal variance weight
#> Used 1630 common genes...
#> Used 6 cell types in deconvolution...
#> HD3021b2ee377f8711ec9bf265fb9bf6ab9cPBMC21b2ee377f8711ec9bf265fb9bf6ab9c0 has common genes 1559 ...
#> WNNLS Converged at iteration 72
#> HD3021b2ee377f8711ec9bf265fb9bf6ab9cPBMC21b2ee377f8711ec9bf265fb9bf6ab9c1 has common genes 1556 ...
#> WNNLS Converged at iteration 3
#> HD3021b2ee377f8711ec9bf265fb9bf6ab9cPBMC21b2ee377f8711ec9bf265fb9bf6ab9c3 has common genes 1565 ...
#> WNNLS Converged at iteration 10
#> HD3021b2ee377f8711ec9bf265fb9bf6ab9cPBMC21b2ee377f8711ec9bf265fb9bf6ab9c7 has common genes 1559 ...
#> WNNLS Converged at iteration 14
#> HD3121b2ee377f8711ec9bf265fb9bf6ab9cPBMC21b2ee377f8711ec9bf265fb9bf6ab9c0 has common genes 1571 ...
#> WNNLS Converged at iteration 4
#> HD3121b2ee377f8711ec9bf265fb9bf6ab9cPBMC21b2ee377f8711ec9bf265fb9bf6ab9c1 has common genes 1556 ...
#> WNNLS Converged at iteration 1
#> HD3121b2ee377f8711ec9bf265fb9bf6ab9cPBMC21b2ee377f8711ec9bf265fb9bf6ab9c3 has common genes 1546 ...
#> WNNLS Converged at iteration 1
#> HD3121b2ee377f8711ec9bf265fb9bf6ab9cPBMC21b2ee377f8711ec9bf265fb9bf6ab9c7 has common genes 1558 ...
#> WNNLS Converged at iteration 3

result_list <- list(SCDC = res_scdc, Bisque = res_bisque)

# Merging the two T cell props
result_list <- lapply(result_list, function(x) {
  cbind(x, T = (x[, "CD4 T"] + x[, "CD8 T"]))[, -c(2, 3)]
})
make_benchmarking_scatterplot(result_list, RefData)

# Alternative if you want to save the plot in a file
# make_benchmarking_scatterplot(result_list, RefData, "predictionVsGroundtruth.png")
# Alternative if you want to save the plot in a file
# make_benchmarking_scatterplot(result_list, RefData, "predictionVsGroundtruth.png")