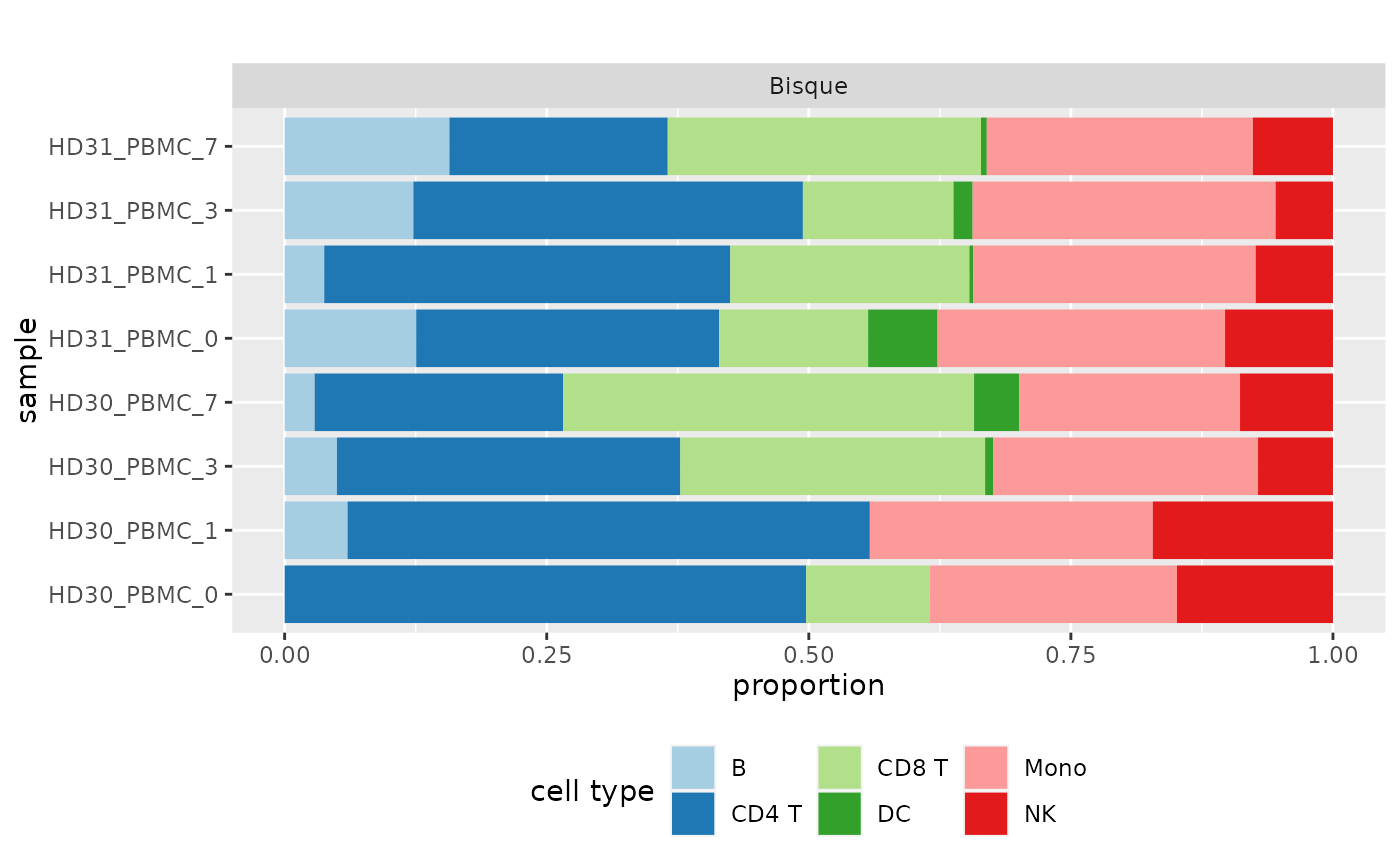
Plot deconvolution results as a barplot
make_barplot(result_list, title = "", file_name = NULL)Arguments
Value
the ggplot object
Examples
data("single_cell_data_1")
data("cell_type_annotations_1")
data("batch_ids_1")
data("bulk")
data("RefData")

common_genes <- intersect(rownames(single_cell_data_1), rownames(bulk))[1:2000]

single_cell_data <- single_cell_data_1[common_genes, 1:500]
cell_type_annotations <- cell_type_annotations_1[1:500]
batch_ids <- batch_ids_1[1:500]
bulk <- bulk[common_genes, ]

deconvolution <- deconvolute(
  bulk, NULL, "bisque", single_cell_data,
  cell_type_annotations, batch_ids
)
deconvolution <- list(deconvolution)
names(deconvolution) <- "Bisque"
make_barplot(deconvolution)