Detailed Usage Example - Mouse data
Source:vignettes/detailed_example_mouse.Rmd
detailed_example_mouse.RmdAs previously done for the human deconvolution methods,
Immunedeconv includes an example dataset with samples from
mouse blood and spleen from (Petitprez et al.
2020). It is available from
immunedeconv::dataset_petitprez. It contains a gene
expression matrix (dataset_petitprez$expr_mat) generated
using bulk RNA-seq and ‘gold standard’ estimates of immune cell contents
profiled with FACS (dataset_petitprez$ref). We are going to
use the bulk RNA-seq data to run the deconvolution methods and will
compare the results to the FACS data later on.
# show the first 5 lines of the gene expression matrix
knitr::kable(dataset_petitprez$expr_mat[1:5, ])| MCP2_BL1 | MCP2_BL2 | MCP2_Sp1 | MCP2_Sp2 | MCP4_BL1 | MCP4_BL2 | |
|---|---|---|---|---|---|---|
| Rn18s | 10126.783 | 20242.132 | 5804.110 | 7848.710 | 16926.178 | 14015.107 |
| mt-Co1 | 7412.649 | 7498.994 | 21293.790 | 18879.589 | 6666.412 | 7417.677 |
| Eef1a1 | 4309.191 | 4917.897 | 9011.338 | 9093.948 | 4353.079 | 3924.303 |
| Gm10925 | 3646.178 | 3456.046 | 13329.570 | 11212.637 | 4333.629 | 5104.390 |
| Tpt1 | 4762.629 | 4677.535 | 8284.424 | 7918.483 | 4471.157 | 4006.737 |
Deconvolution with mouse-based methods
To estimate immune cell fractions, we simply have to invoke the
deconvolute_mouse function. It requires the specification
of one of the following methods for deconvolution:
deconvolution_methods_mouse## mMCPcounter seqImmuCC DCQ BASE
## "mmcp_counter" "seqimmucc" "dcq" "base"For this example, we use mMCPcounter. As a result, we
obtain a cell_type x sample data frame with cell-type scores for each
sample.
res_mMCPcounter <- deconvolute_mouse(dataset_petitprez$expr_mat, "mmcp_counter")Similarly to its human counterpart, mMCP-counter provides scores in arbitrary units that are only comparable between samples, but not between cell-types.
res_mMCPcounter <- res_mMCPcounter[res_mMCPcounter$cell_type %in% colnames(dataset_petitprez$ref), ]


res_mMCPcounter %>%
  gather(sample, score, -cell_type) %>%
  ggplot(aes(x = sample, y = score, color = cell_type)) +
  geom_point(size = 4) +
  facet_wrap(~cell_type, scales = "free_x", ncol = 3) +
  scale_color_brewer(palette = "Paired", guide = FALSE) +
  coord_flip() +
  theme_bw() +
  theme(axis.text.x = element_text(angle = 90, vjust = 0.5, hjust = 1))
## Warning: The `guide` argument in `scale_*()` cannot be `FALSE`. This was deprecated in
## ggplot2 3.3.4.
## ℹ Please use "none" instead.
## This warning is displayed once every 8 hours.
## Call `lifecycle::last_lifecycle_warnings()` to see where this warning was
## generated.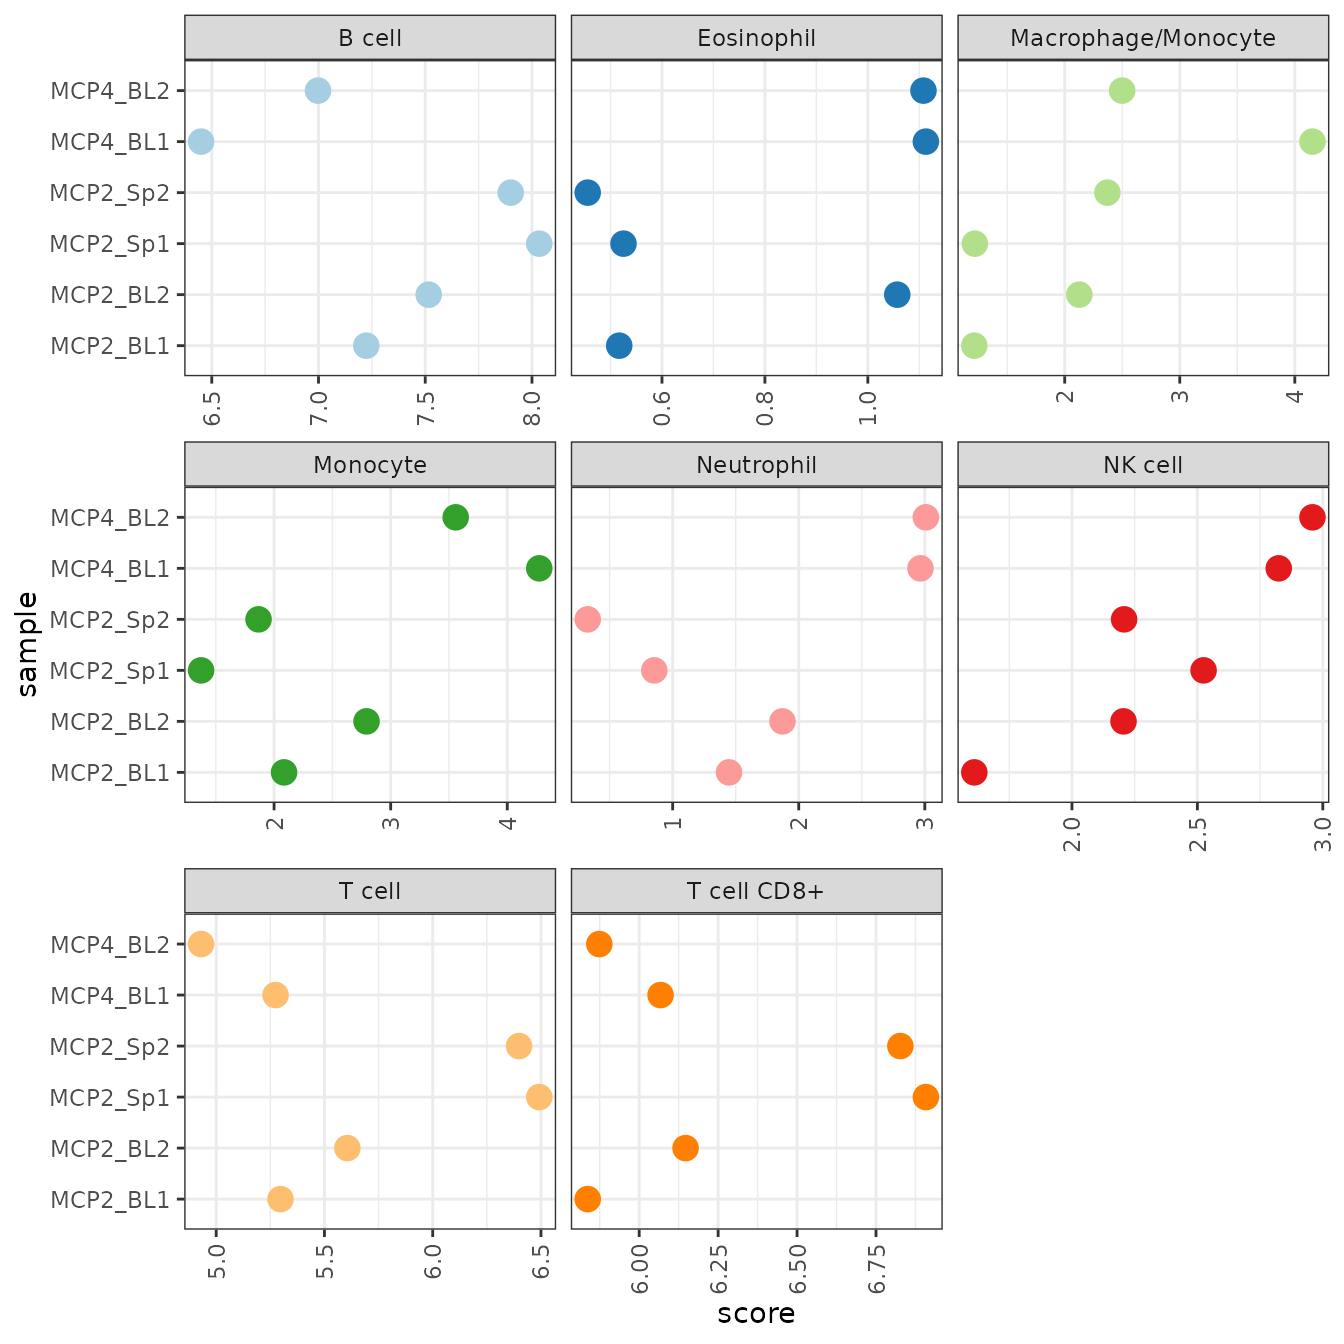
Deconvolution with human-based methods
Human-based methods can still be used to deconvolve mouse data
through the use of orthologous genes. The function
mouse_genes_to_human does that by retrieving the
correspondent gene names with biomaRt. Since the gene names
are retrieved from the Ensembl database, it can happen that the command
has to be run with different Emsembl mirrors (see the documentation)
dataset_petitprez_humanGenes <- convert_human_mouse_genes(dataset_petitprez$expr_mat, convert_to = 'human')
res_MCPcounter <- deconvolute(dataset_petitprez_humanGenes, 'mcp_counter')
Comparison with FACS data
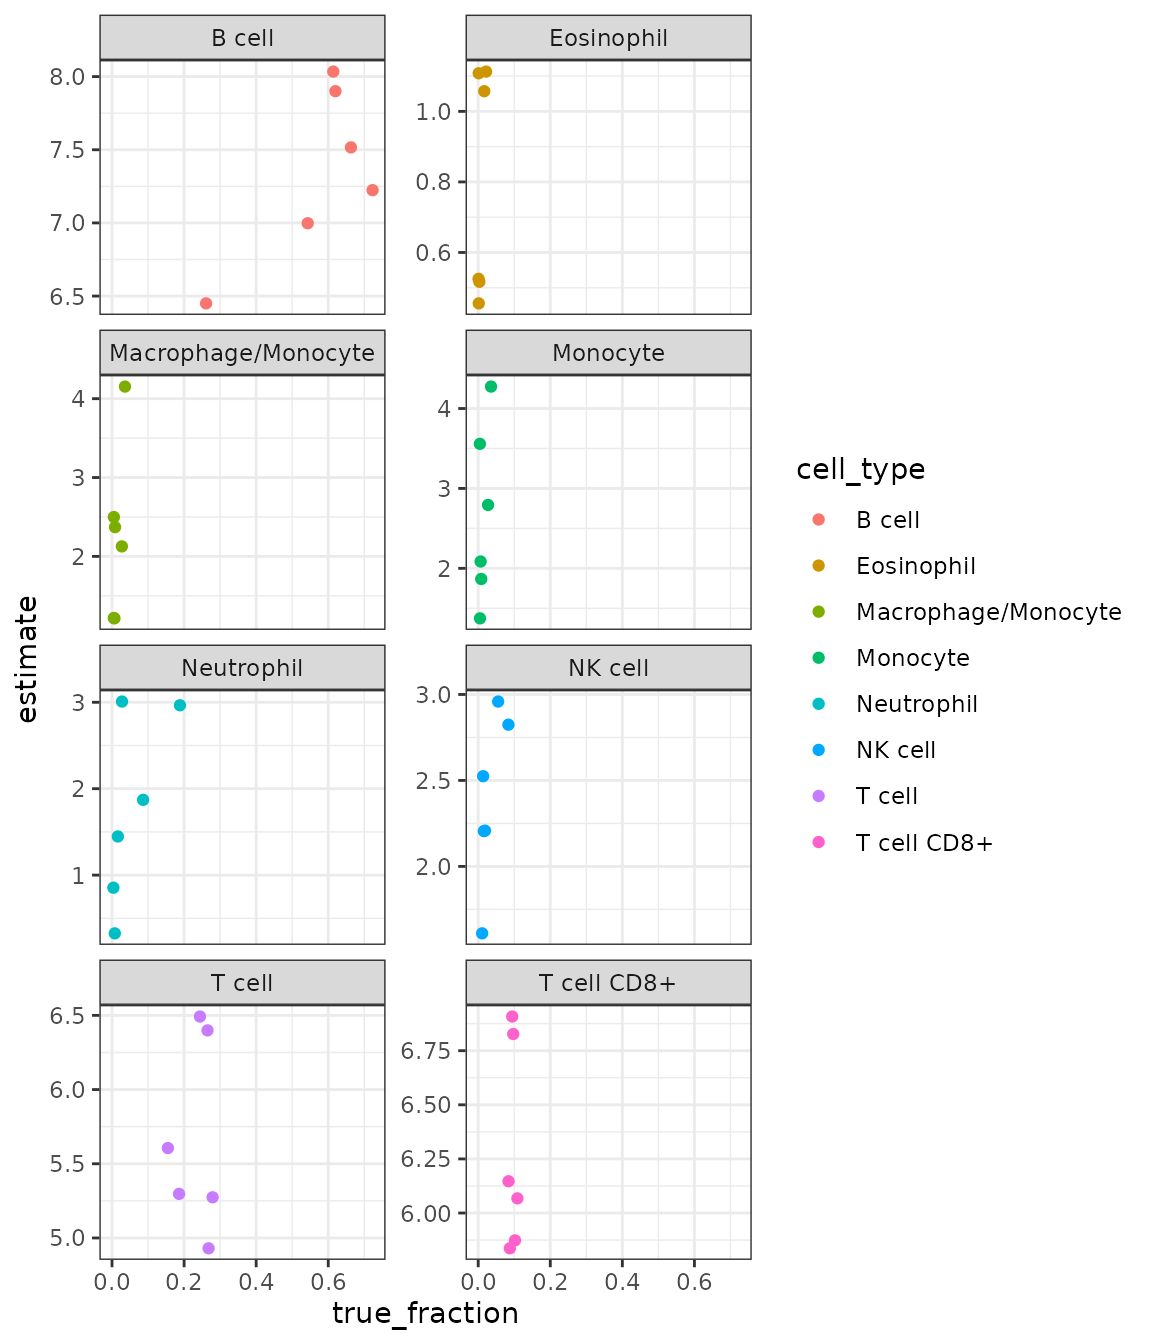
Let’s now compare the results with ‘gold standard’ FACS data obtained for the four samples. This is, of course, not a representative benchmark, but it gives a notion about what magnitude of predictive accuracy we can expect.
# construct a single dataframe containing all data
#
# re-map the cell-types to common names.
# only include the cell-types that are measured using FACS
cell_types <- c("B cell", "T cell CD8+", "T cell", "NK cell", "Monocyte")

tmp_res <- res_mMCPcounter %>%
  gather("sample", "estimate", -cell_type)

reference_facs <- dataset_petitprez$ref %>%
  gather("cell_type", "true_fraction", -"Sample Name") %>%
  set_colnames(., c("sample", "cell_type", "true_fraction"))

result <- tmp_res %>%
  inner_join(reference_facs)
Plot the true vs. estimated values:
result %>%
  ggplot(aes(x = true_fraction, y = estimate)) +
  geom_point(aes(color = cell_type)) +
  facet_wrap(. ~ cell_type, scales = "free_y", ncol = 2) +
  theme_bw()